Difference between revisions of "Projets-2016-2017-Plateform Analyse Données IOT"
Jump to navigation
Jump to search
| Line 20: | Line 20: | ||
*Two possible solutions to retrieve data collected by the house sensors : |
*Two possible solutions to retrieve data collected by the house sensors : |
||
**KNX gateway, prepared as a binary image that can be written to an SD card for a RaspberryPI |
**KNX gateway, prepared as a binary image that can be written to an SD card for a RaspberryPI |
||
| − | **[[Projets-2016-2017-Plateform_Analyse_Donn%C3%A9es_IOT/SpaceLYnk | |
+ | **Programming the [[Projets-2016-2017-Plateform_Analyse_Donn%C3%A9es_IOT/SpaceLYnk | SpaceLYnk]] in LUA |
***http://www.schneider-electric.fr/fr/product-range/62958-spacelynk/ |
***http://www.schneider-electric.fr/fr/product-range/62958-spacelynk/ |
||
***http://download.schneider-electric.com/files?p_Doc_Ref=ZZ5354_FR |
***http://download.schneider-electric.com/files?p_Doc_Ref=ZZ5354_FR |
||
Revision as of 00:21, 4 February 2017
Team
- Supervisors : Daniel Hilaire, Jean-Louis Bergerand, Nicolas Palix, Olivier Richard
- Members : Estelle Allard, Lambert Rocher
- Departement : RICM 4, RICM 4, Polytech Grenoble
Week 1 (January 9th - January 15th)
- Choix du projet et compléments d'informations concernant les objectifs du projet
Week 2 (January 16th - January 22th)
- Discovery of the project
- Contatc with Daniel Hilaire and Jean-Louis Bergerand
- Search for information on Docker and OpenHab
- Statement of requirements
Meeting with Daniel Hilaire and Jean-Louis Bergerand (Wednesday 18/01/2017)
- Two possible solutions to retrieve data collected by the house sensors :
- KNX gateway, prepared as a binary image that can be written to an SD card for a RaspberryPI
- Programming the SpaceLYnk in LUA
- Worthwhile data analysis : temperature and energy consumption compared to weather, indoor air quality
Week 3 (January 23th- January 29th)
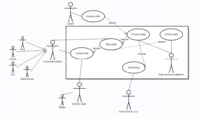
- Création d'un diagramme des cas d'utilisation
- Execution of a docker image running influxDB and grafana (dockerfile found on dockerhub).
- Manual addition of data in the database using the http api.
- Visualization of these data in a grafana dashboard.
