Projets-2016-2017-Serres connectées
Project presentation
The project subject : Serres connectées.
The project consist of upgrading a classic greenhouse to retrieve live information about its climate. The farm exploitation is located in Saint-Cassien (38500), in the French Alps.
Data to retrieve :
- Air temperature
- Air moisture
- Soil moisture
Control of these parameters are essentials to avoid disease, enhance the growth of the plantations and limit water consumption.
Two main constrains :
- No power in the zone
- Sensors needs to be moveable to let vehicles move along the greenhouse
Team
- Supervisor: Nicolas Palix and Vincent Hibon
- Members: Antoine Boisadam, Oriane Dalle
- Department: RICM 4, Polytech Grenoble
Documents
Calendar
The project started on January 9th, 2017.
Week 1 (January 9th - January 12th)
- Project selection (List of all subjects)
Week 2 (January 13th - January 19th)
- Introduction to LoRa by Didier Donsez.
- Discovery of the project
- Setup of our computers to be able to program our Adafruit Feather.
- First Hello world with the hardware (Discussion between two Adafruit Feather 32u4 in LoRa)
- Call with one of the managers of the farm, Vincent, the feeling is good with him, we spoke during one hour :
- He spoke about him and his wife farm exploitation
- He detailed the farm layout
- We asked him some precise questions about the project (Types and numbers of sensors wanted, data wanted, ...)
- We agree on a meeting for the next Wednesday (25/01/2017)
Week 3 (January 20th - January 26th)
- Define the use case diagram
- Taking charge of the Adafruit Feather card and the PyCom one.
- We wrote a little program that is able to send and receive data. At the moment these data are fake temperature until we embedded real sensors
- We determinate the length maximum of data that we can sent to be able to record data each 30 minutes and respect the duty cycle (1% of the time)
- The meeting was canceled by the managers of the farm and reported to the 8th of February
Week 4 (January 27th - February 5th)
- No official time slot for the projec this week (Postpouned)
- Call with Vincent Hibon on the 1st of Feb. We spoke about the advancement of the project.
Week 5 (February 6th - February 12th)
- We got some new hardware : Mbed SX1272 with a ST Nucleo board, therefore we have to re-setup our computers to makes these cards working. Adafruit cards will be given to the project n°2.
- On wednesday afternoon, first meeting at the farm with Vincent. We also meet Isabelle, Vincent's wife, the manager of the farm. Here is a report of this afternoon (in French).
- There are some pictures picked today (yes, the forecast wasn't very good...) :
Week 6 (February 13th - February 19th)
- Monday:
- We are very disheartened with these new STM32 cards. Three other hours lost in making research about how to make it works.
- Tuesday:
- Nice day ! Finally STM32 worked today, we were able to run the "PingPong" example program (link) and exchange some data
- We are able to transform voltage from the temperature sensor[1] to degree celsius.
- NB: We use
picocom /dev/tty.usbmodem1423on macOS 10.12 and Putty (/dev/ttyACM0) on Ubuntu to have a console output.
- Thursday:
- Didier Donsez gave us a new sensor that is able to record temperature AND moisture.
- Setup NodeRed + InfluxDB (docker) in contemplation of this tutorial : Developing IoT Mashups with Docker, MQTT, Node-RED, InfluxDB, Grafana.
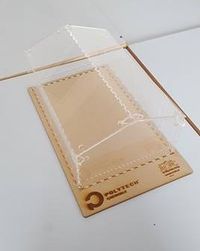
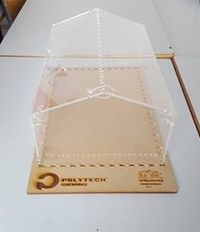
- We also speak about the Eclipse IoT Day Grenoble 2017 and sent mail to the Fablab in order to create a 3D Greenhouse in Plexiglass
Week 7 (February 20th - February 26th)
- Polytech holidays
- Setup and training with this tutorial : Developping IoT Mashups with Docker, MQTT, Node-RED, InfluxDB, Grafana
Week 8 (February 27th - March 5th)
- Work on the I-Greenhouse progress summary
- Designing a 3D plan for a Plexiglas greenhouse
- Going to the FabLab in order to carve the model. The base is made of MDF (Medium-density fiberboard) and the structure is made of Plexiglas.
- Set-up Node-red, we are able to retrieve data printed by the device (connected on
/dev/ttyACM0)- The Extract data function :
1setTimeout(function() { node.status({}); }, 500)
2node.status({fill:"green",shape:"dot",text:"updated"});
3return msg;
Week 9 (March 6th - March 12th)
- Node-red, Mosquitto, InfluxDB and Grafana
- Our two node-red flow :
[ {"id":"bf6a6bfb.ad6698","type":"tab","label":"Flow 1"}, {"id":"48fb29d6.8abc8","type":"tab","label":"Flow 2"}, {"id":"a6ed7ef6.c3b1b","type":"serial-port","z":"","serialport":"/dev/tty.usbmodem1423","serialbaud":"9600","databits":"8","parity":"none","stopbits":"1","newline":"\\n","bin":"false","out":"char","addchar":false}, {"id":"cd1cd4b5.89a1b8","type":"mqtt-broker","z":"","broker":"localhost","port":"1883","clientid":"","usetls":false,"compatmode":true,"keepalive":"60","cleansession":true,"willTopic":"","willQos":"0","willPayload":"","birthTopic":"","birthQos":"0","birthPayload":""},{"id":"45f90f43.5971c8","type":"influxdb","z":"","hostname":"localhost","port":"8086","protocol":"http","database":"iotdb","name":""}, {"id":"adb5fbbd.36c6d8","type":"influxdb","z":"","hostname":"127.0.0.1","port":"8086","protocol":"http","database":"yyu","name":""},{"id":"c74aaa1a.718428","type":"serial in","z":"bf6a6bfb.ad6698","name":"USBModem1423 (9600)","serial":"a6ed7ef6.c3b1b","x":190.5,"y":300,"wires":[["a999cf.d1e0163"]]}, {"id":"a999cf.d1e0163","type":"function","z":"bf6a6bfb.ad6698","name":"debugFunction","func":" setTimeout(function() { node.status({}); }, 500)\n\n node.status({fill:\"green\",shape:\"dot\",text:\"updated\"});\n\n return msg;","outputs":1,"noerr":0,"x":567.5,"y":237,"wires":[["bedd3839.57329"]]},{"id":"bedd3839.57329","type":"mqtt out","z":"bf6a6bfb.ad6698","name":"","topic":"iotdays/sensors","qos":"","retain":"","broker":"cd1cd4b5.89a1b8","x":956.5,"y":243,"wires":[]},{"id":"5c859882.c8211","type":"mqtt in","z":"48fb29d6.8abc8","name":"","topic":"iotdays/sensors","qos":"2","broker":"cd1cd4b5.89a1b8","x":323.5,"y":261,"wires":[["2b58b71.959ec48","a8ea218a.b140b8"]]}, {"id":"2b58b71.959ec48","type":"debug","z":"48fb29d6.8abc8","name":"","active":true,"console":"false","complete":"payload","x":768.5,"y":138,"wires":[]}, {"id":"a8ea218a.b140b8","type":"influxdb out","z":"48fb29d6.8abc8","influxdb":"45f90f43.5971c8","name":"IoT DB temperature","measurement":"temperature","x":734.5,"y":399,"wires":[]} ]
- We produced the Eclipse IoT Day Poster, here is the final version
- Demo at the Eclipse IoT Day 2017 (Resume coming soon)
- Second version with multiple measurements :
[{"id":"bf6a6bfb.ad6698","type":"tab","label":"Flow 1"},{"id":"48fb29d6.8abc8","type":"tab","label":"Flow 2"},{"id":"a6ed7ef6.c3b1b","type":"serial-port","z":"","serialport":"/dev/tty.usbmodem1423","serialbaud":"9600","databits":"8","parity":"none","stopbits":"1","newline":"\\n","bin":"false","out":"char","addchar":false},{"id":"cd1cd4b5.89a1b8","type":"mqtt-broker","z":"","broker":"localhost","port":"1883","clientid":"","usetls":false,"compatmode":true,"keepalive":"60","cleansession":true,"willTopic":"","willQos":"0","willPayload":"","birthTopic":"","birthQos":"0","birthPayload":""},{"id":"45f90f43.5971c8","type":"influxdb","z":"","hostname":"localhost","port":"8086","protocol":"http","database":"iotdb","name":""},{"id":"adb5fbbd.36c6d8","type":"influxdb","z":"","hostname":"127.0.0.1","port":"8086","protocol":"http","database":"yyu","name":""},{"id":"c74aaa1a.718428","type":"serial in","z":"bf6a6bfb.ad6698","name":"USBModem1423 (9600)","serial":"a6ed7ef6.c3b1b","x":180.5,"y":321,"wires":[["a999cf.d1e0163"]]},{"id":"a999cf.d1e0163","type":"function","z":"bf6a6bfb.ad6698","name":"debugFunction","func":" setTimeout(function() { node.status({}); }, 500)\n\n node.status({fill:\"green\",shape:\"dot\",text:\"updated\"});\n\n return msg;","outputs":1,"noerr":0,"x":583.5,"y":278,"wires":[["bedd3839.57329"]]},{"id":"bedd3839.57329","type":"mqtt out","z":"bf6a6bfb.ad6698","name":"","topic":"iotdays/sensors","qos":"","retain":"","broker":"cd1cd4b5.89a1b8","x":956.5,"y":243,"wires":[]},{"id":"2b58b71.959ec48","type":"debug","z":"48fb29d6.8abc8","name":"","active":true,"console":"false","complete":"true","x":814.5,"y":323,"wires":[]},{"id":"a52ed1fe.56465","type":"function","z":"48fb29d6.8abc8","name":"Set Measurement","func":"var prefixT = \"Temp=\";\nvar prefixH = \"Humi=\";\n\nvar m = msg.payload;\n\nvar t = m.indexOf(prefixT);\nvar h = m.indexOf(prefixH);\n\nif(t === 0 || h === 0) {\n msg.payload = m.substr(prefixT.length).trim(); // prefixT.length == prefixH.length\n msg.measurement = (t === 0 ? \"temperature\" : \"humidity\");\n setTimeout(function() { node.status({}); }, 500)\n node.status({fill:\"green\",shape:\"dot\",text:\"updated\"});\n return msg;\n} else {\n return null;\n}","outputs":1,"noerr":0,"x":530,"y":441,"wires":[["fd9f5fc1.24d15","2b58b71.959ec48"]]},{"id":"ccd5b74a.579bb8","type":"mqtt in","z":"48fb29d6.8abc8","name":"","topic":"iotdays/sensors","qos":"2","broker":"cd1cd4b5.89a1b8","x":239,"y":441,"wires":[["a52ed1fe.56465"]]},{"id":"fd9f5fc1.24d15","type":"influxdb out","z":"48fb29d6.8abc8","influxdb":"45f90f43.5971c8","name":"IoT DB","measurement":"","x":806,"y":443,"wires":[]}]
- Demonstration with the greenhouse mockup at the Eclipse IoT Days 2017 :
- We explained the project and made some demonstrations with the mockup and live data (and Grafana).
- During this day we were present at the SigFox presentation.
 Oriane DALLE and Antoine BOISADAM on this project. Charles MARCHAND and Marion PELLICIER on the Serre connectée acquaponie project |
Week 10 (March 13th - March 20th)
- We produced two codes, by forking the SX1272Ping-Pong program :
- And two others in order to use sensors
- Moisture and temperature in the soil : https://developer.mbed.org/users/dalleo/code/DHT11_Temp_Hum_Air/
- Moisture and temperature in the air : https://developer.mbed.org/users/dalleo/code/SHT10_Temp_Hum_Sol/
- Participation at the Maker-Faire Grenoble 2017
 Charles MARCHAND at the Maker-Faire Grenoble 2017 |
Week 11 (March 20th - March 26th)
- We are able to supply the nucleo cards with a solar panel.
- We used the CN6 4th pin for the +3v3 and the CN6 6th pin for th GND.Cheatsheet of the Nucleo-L073RZ
- We started to write our final report
- Communication with Vincent Hibon about the project progress
- Didier Donsez provides to us a MQTT server adress and topic. We integrated it into our node-red flows.
Week 12 (March 27th - April 2nd)
- We created a node-red Dockerfile with our flows to simplify the installation on the farm computer : Github
- Edition of our code Mbed
- Think about optimization of data sent (Binaries instead of characters)
- We were able to optimize. Now, instead of 1024 bytes, we send 6 bytes !
- Here is our message cutting:
| measurement 4 | measurement 3 | measurement 2 | measurement 1 | measurements types | greenhouse informations | ||||||||||||||||||||||||||||||||||||||||||
|---|---|---|---|---|---|---|---|---|---|---|---|---|---|---|---|---|---|---|---|---|---|---|---|---|---|---|---|---|---|---|---|---|---|---|---|---|---|---|---|---|---|---|---|---|---|---|---|
| 47 | 46 | 45 | 44 | 43 | 42 | 41 | 40 | 39 | 38 | 37 | 36 | 35 | 34 | 33 | 32 | 31 | 30 | 29 | 28 | 27 | 26 | 25 | 24 | 23 | 22 | 21 | 20 | 19 | 18 | 17 | 16 | 15 | 14 | 13 | 12 | 11 | 10 | 9 | 8 | 7 | 6 | 5 | 4 | 3 | 2 | 1 | 0 |
- Greenhouse informations (0 to 7):
- Bits 0 to 3 represents the greenhouse number (Can be 0 to 15)
- Bits 5 and 4 represents the sensors positions in the greenhouse
- 00 -> extremity 1
- 01 -> middle
- 10 -> extremity 2
- Bits 7 and 6 are not used (have to be 0)
- Types (8 to 15):
- Bits 9 and 8 represents the type of the measurement 4, bits 10 and 11 the type of the measurement 3, ...
- In this byte, all bits have a partner.
- The first bit represent the measurement type
- 0 -> Temperature
- 1 -> Humidity
- The second bit is the sensor type
- 0 -> Air
- 1 -> Soil
- Bits 9 and 8 represents the type of the measurement 4, bits 10 and 11 the type of the measurement 3, ...
- Each measurements (16 to 47) are encoded on 8 bits.
- We transform our float to uint8 with a personal magic formula.
- Preparation of the demo, final report and final slides


